Candlestick Patterns for Crypto Trading Strategies
As an aspiring crypto trader, you may not be aware that candlestick patterns can provide powerful insights into market sentiment, indicating potential bullish or bearish trends. By identifying and interpreting these formations, such as Doji and Engulfing, you can enhance your trading decisions and potentially improve your entry and exit accuracy. However, to harness the full potential of candlestick analysis, you’ll need to understand how to effectively combine it with other technical indicators and market trend analysis. Dive deeper to discover how mastering candlestick patterns can elevate your cryptocurrency trading strategies.
Key Takeaways
- Familiarize with bullish candlestick patterns like Doji, Bullish Engulfing, and Three White Soldiers to identify potential uptrends in the crypto market.
- Recognize bearish candlestick patterns like Bearish Engulfing, Bearish Shooting Star, and Hanging Man to anticipate potential downturns in the crypto market.
- Combine candlestick pattern analysis with other technical indicators like Relative Volume and Oscillators to enhance the accuracy of entry and exit decisions.
- Utilize candlestick patterns to identify potential trend changes, such as Engulfing patterns for trend reversals and Star patterns for trend pauses.
- Interpret the relationship between opening and closing prices in candlestick formations to gauge bullish or bearish market sentiment in the crypto market.
Understanding Candlestick Patterns
Candlestick patterns are a powerful tool in the world of crypto trading strategies. These visual representations of price movements provide valuable insights into market sentiment. Bullish patterns, like the hammer and morning star, signal potential uptrends, while bearish patterns, like the shooting star and hanging man, warn of potential downturns. Understanding how to identify and interpret these candlestick formations is pivotal for making informed trading decisions. By analyzing the relationship between the open, high, low, and close prices depicted in each candle, traders can better understand the underlying market psychology and anticipate future price trends. Mastering candlestick pattern recognition can give you a competitive edge in the dynamic crypto trading landscape.
Identifying Bullish Candlestick Patterns
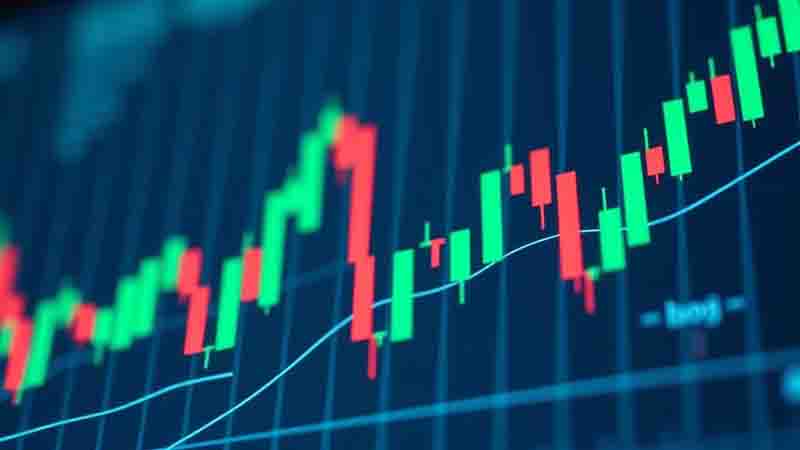
Identifying bullish candlestick patterns is an essential skill for traversing the crypto trading landscape successfully. These patterns signal potential price increases, offering valuable insights for your crypto trading strategies. Let’s explore some commonly observed bullish patterns:
| Pattern | Description |
|---|---|
| Doji Candlestick Patterns | Signify market indecision, often preceding bullish reversals. |
| Bullish Engulfing | Where a green candle completely engulfs the previous red candle. |
| Three White Soldiers | Three consecutive green candles, indicating a strong bullish trend. |
Additionally, the Dragonfly Doji, Morning Star, and Hammer Candlestick Patterns all indicate bullish sentiment in the crypto market. Familiarize yourself with these patterns to enhance your trading prowess and capitalize on emerging bullish opportunities.
Recognizing Bearish Candlestick Patterns
While bullish patterns signal potential price increases, you’ll also want to be aware of bearish candlestick formations that may indicate a trend reversal. The Bearish Engulfing pattern, Bearish Shooting Star, and Bearish Evening Star all suggest an impending downward move. The Hanging Man and Dark Cloud Cover patterns also point to a potential shift from bullish to bearish market sentiment. To identify these bearish signals, watch for:
- Larger bearish candles that “engulf” previous bullish ones
- Long upper wicks and small bodies hinting at selling pressure
- Three-candle formations with a neutral middle candle
Recognizing these bearish candlestick patterns can help you anticipate and prepare for a possible trend reversal from bullish to bearish.
Combining Candlestick Patterns With Other Technical Indicators
To enhance the reliability of your trading signals in the volatile crypto market, you’ll want to integrate candlestick patterns with other technical indicators. Analyzing candlestick patterns in conjunction with Relative Volume can provide a more thorough understanding of market sentiment and momentum. Using candlestick patterns like the Hammer Pattern, Bullish Engulfing Candlestick Pattern, Gravestone Doji Candlestick Patterns, Inverted Hammer Candlestick Pattern, and Spinning Top Candlestick Pattern to confirm signals from momentum indicators like the Relative Strength Index (RSI) or the Stochastic Oscillator can improve the accuracy of your entry and exit points. Additionally, aligning candlestick patterns with support and resistance levels can help you identify key price levels for implementing stop-loss and take-profit orders.
Candlestick Patterns and Market Trend Analysis
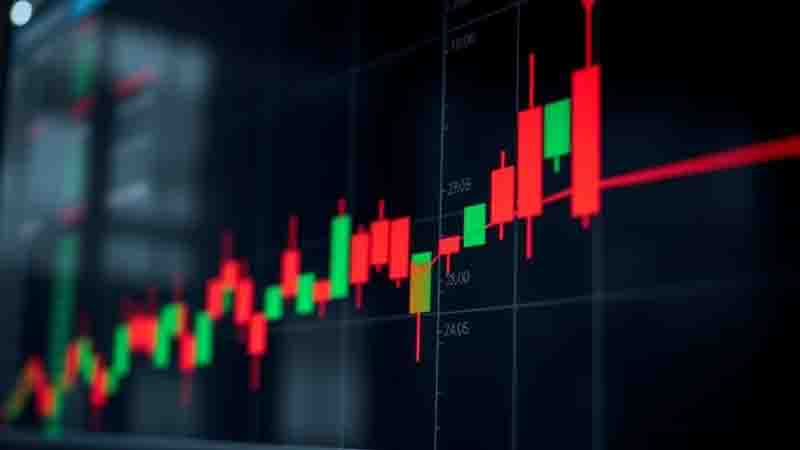
Candlestick patterns can provide valuable insights into the overall market trend when analyzed in conjunction with other technical indicators. Traders can utilize candlestick patterns to identify potential reversal signals, such as:
Candlestick patterns offer valuable insights into market trends when analyzed alongside other technical indicators, enabling the identification of potential reversal signals.
- Engulfing patterns, where a large candle body engulfs the previous candle’s body, indicating a potential trend change.
- Star patterns, where a small candle opens and closes near the middle of the previous candle’s body, suggesting a pause in the current trend.
- Opening/closing price relationships, where the opening or closing price of a candle relative to the previous candle can signal a bullish or bearish market sentiment.
Applying Candlestick Patterns to Cryptocurrency Trading Strategies
Given the volatile and dynamic nature of the cryptocurrency market, you’ll find that candlestick pattern analysis can be a powerful tool in your trading arsenal. By identifying key patterns like Bullish Engulfing, Hammer, Gravestone Doji, Inverted Hammer, and Spinning Top, you can gain insights into market sentiment and potential trend reversals. Integrating this technical analysis with other indicators like trading volume can enhance the accuracy of your trading signals. In addition, understanding these patterns can aid in setting effective stop-loss and take-profit orders, helping you manage risk in your crypto trading strategies. Leveraging candlestick patterns can be a game-changer in traversing the 24/7 cryptocurrency market and identifying profitable opportunities.
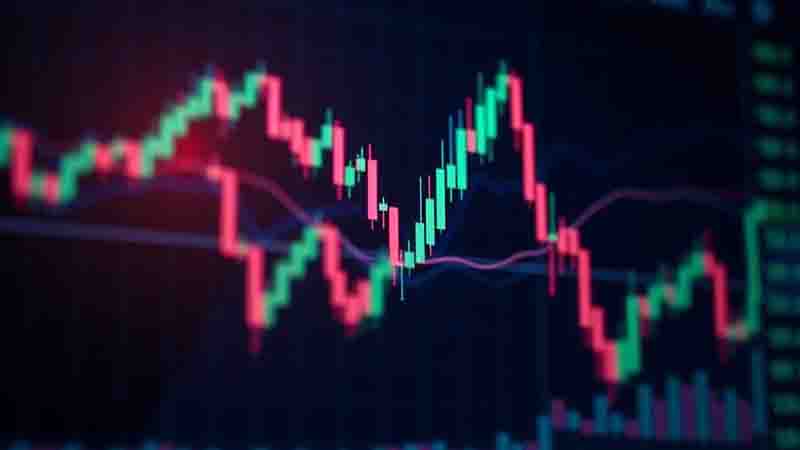
Timely Execution: Leveraging Candlestick Patterns for Entry and Exit Points
Effective timing is essential when executing trades in the volatile cryptocurrency market. Leveraging candlestick patterns through technical analysis can help you identify suitable entry and exit points for your crypto trading strategies.
Some key candlestick patterns to watch for include:
- Bullish Engulfing: Signals a potential trend reversal from bearish to bullish.
- Hammer and Inverted Hammer: Indicate a possible bottom or price support.
- Gravestone and Perfect Gravestone Doji: Suggest a potential top or price resistance.
Mitigating Risks: Using Candlestick Patterns for Stop-Loss and Take-Profit Levels
Identifying suitable stop-loss and take-profit levels is crucial for managing risk in the volatile cryptocurrency market. Candlestick patterns can aid traders in determining these critical levels. Analyzing the size and placement of candlestick shadows and bodies can help set take-profit targets based on expected price movements. Patterns like the Hammer and Inverted Hammer often signal potential trend reversals, allowing traders to place stop-losses above or below the pattern’s extremes. The Bullish Engulfing pattern can indicate a bullish reversal, prompting traders to place stop-losses below the pattern’s low and take-profit targets based on the pattern’s height. Incorporating multiple candlestick patterns alongside other technical indicators can enhance the accuracy of stop-loss and take-profit levels in volatile crypto markets.
Customizing Candlestick Pattern Filters on the Altfins Crypto Screener
The altFINS Crypto Screener offers a range of preset candlestick pattern filters, allowing you to quickly identify potential trading opportunities. You can also create custom pattern screens, using over 120 technical indicators, to optimize your crypto trading strategies. Leveraging the screener’s robust customization capabilities, you can fine-tune your candlestick pattern analysis for the volatile cryptocurrency markets.
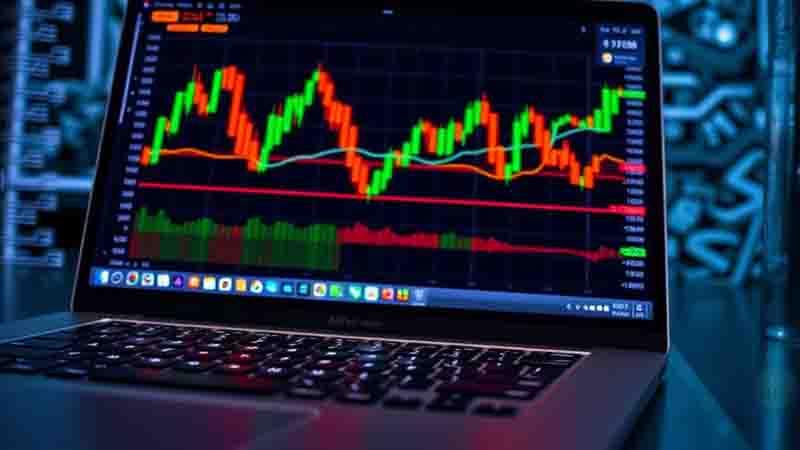
Preset Pattern Filters
Although the altFINS Crypto Screener comes with a range of pre-set filters for popular candlestick patterns, you can also customize these filters to align with your unique trading strategies. The Preset Filters section allows you to quickly identify and analyze key technical indicators, including bullish and bearish formations like Bullish Engulfing, Hammer Candlestick Pattern, Gravestone Doji, Inverted Hammer, and Spinning Top.
- The Signals Summary on altFINS provides an overview of these candlestick patterns and other technical indicators, giving you an extensive view of market signals.
- Leveraging the Crypto Screener’s preset and customizable filters can enhance your technical analysis and decision-making in the volatile crypto markets.
- By combining the power of the altFINS platform’s Candlestick Pattern filters, you can refine your trading strategies and capitalize on emerging opportunities.
Custom Pattern Screens
Customizing the candlestick pattern filters on the altFINS Crypto Screener allows you to fine-tune your technical analysis and uncover valuable trading signals tailored to your specific strategies. With the ability to create custom pattern screens, you can target bullish patterns like the Bullish Engulfing, Hammer, and Inverted Hammer, as well as bearish signals such as the Gravestone and Perfect Gravestone Doji, and the Spinning Top. This level of customization empowers you to identify chart patterns that align with your trading approach, providing a more nuanced and personalized technical analysis workflow within the altFINS platform.
Optimizing Pattern Strategies
Accessing the full potential of the altFINS Crypto Screener begins with customizing the candlestick pattern filters to align with your unique trading strategies. By leveraging the advanced pattern recognition capabilities of the platform, you can identify potential trend reversals, continuations, and consolidation phases in the volatile crypto markets.
To optimize your pattern-based strategies:
- Utilize the Signals Summary to gain insights into candlestick patterns and other technical indicators.
- Experiment with preset candlestick pattern filters, such as Hammer, Inverted Hammer, and Doji.
- Customize the pattern filters to suit your trading goals and market conditions, enabling you to tailor your approach for maximum effectiveness.
Harnessing the power of the altFINS Crypto Screener’s customizable candlestick pattern filters can be a game-changer in your crypto trading journey.
Frequently Asked Questions
What Are the Best Candlestick Patterns for Crypto Trading?
The best candlestick patterns for crypto trading are those that reliably signal market trends and price reversals. Some top patterns include the bullish engulfing, hammer, and morning star, which indicate potential price increases. Bearish patterns like the bearish engulfing, hanging man, and evening star can signal future price declines. Traders should familiarize themselves with these common candlestick formations and use them in conjunction with other technical indicators to enhance their crypto trading strategies.
Do Candlestick Patterns Work for Crypto?
Do candlestick patterns work for crypto? The answer may surprise you. While candlestick patterns can provide valuable insights, their effectiveness in the highly volatile crypto market is debated. Factors like high liquidity and sudden price swings may diminish their predictive power. However, combining candlestick analysis with other technical and fundamental indicators can enhance trading strategies in the crypto space. The key is to approach candlestick patterns with cautious optimism and a nuanced understanding of their limitations in the dynamic crypto market.
What Is the 5 Candle Rule?
The 5 candle rule is a technical analysis technique that helps traders quickly assess the short-term market direction. By analyzing the last 5 candlesticks on a chart, you can identify potential trend changes and reversal signals, such as bullish or bearish engulfing patterns. This simple yet effective method can be a valuable tool for crypto traders, though it should be used in conjunction with other indicators to confirm trading decisions and manage risk.
What Is the Most Successful Candlestick Pattern?
The most successful candlestick pattern is often considered to be the bullish engulfing pattern. This pattern occurs when a large bullish candle completely engulfs the previous bearish candle, indicating a strong shift in market sentiment from bearish to bullish. The pattern is viewed as a reliable indicator of a potential trend reversal, making it a popular choice among traders looking to capitalize on bullish market opportunities.
Understanding digital asset patterns through candlestick analysis can significantly improve your cryptocurrency trading decisions and overall market timing strategies.
Understanding candlestick patterns is essential for navigating the volatile price movements that characterize crypto monetary systems and digital asset markets.
Understanding candlestick patterns becomes crucial when navigating the volatile price movements inherent in crypto monetary systems and digital asset markets.