
What Technical Indicators Reveal About Crypto Market Cycles?
You may be surprised to learn that the ebb and flow of the crypto market can be predicted to some degree using technical indicators. For instance, declining Bitcoin exchange balances often signal accumulation by long-term holders, while spikes in Google search activity tend to coincide with market cycle peaks. By monitoring these insights, you can gain a deeper understanding of the cyclical nature of the cryptocurrency ecosystem and position yourself for potential opportunities. Intrigued? Let’s delve into how these technical signals can reveal essential insights about the crypto market’s future direction.
Key Takeaways
- Declining exchange balances signal HODLing and reduced selling pressure, indicating an accumulation phase.
- Rising exchange balances suggest selling pressure and market exuberance, potentially signaling a distribution phase.
- Consistent outflows from exchanges can indicate strong hands accumulating, hinting at an uptrend phase.
- Large inflows to exchanges may precede market corrections, foreshadowing a downtrend (bear market) phase.
- Monitoring Google search trends can provide insights into public interest and anticipate turning points in the crypto market cycle.
Understanding the Phases of Crypto Market Cycles
If you want to understand the crypto market’s cyclical nature, you’ll need to familiarize yourself with its four distinct phases. The accumulation phase sees forward-thinking buyers start to accumulate digital assets as prices are relatively low. During the uptrend phase, rising prices are driven by positive news, increasing investor interest, and events like Bitcoin halving. In the distribution phase, early investors begin to sell, indicating a potential downturn as prices reach peaks. The downtrend (bear market) phase is characterized by falling prices, often exacerbated by negative news and market pessimism. Paying attention to these market cycles and corresponding technical indicators can provide valuable insights into price movements and supply and demand dynamics.

Analyzing Bitcoin Exchange Balances and Flows
While centralized exchanges currently account for 12.6% of Bitcoin’s circulating supply, this balance has declined by 17% since the beginning of the year. Tracking exchange flows provides valuable insights into market dynamics and potential price movements. Rising exchange balances signal increased selling pressure and market exuberance, while declining balances indicate HODLing and reduced selling pressure. A consistent outflow from exchanges suggests strong hands accumulating, while large inflows can precede market corrections. Understanding these exchange dynamics is vital for anticipating Bitcoin’s price cycles.
| Indicator | Bullish Signal | Bearish Signal |
|---|---|---|
| Exchange Balances | Declining | Increasing |
| Exchange Flows | Consistent Outflows | Large Inflows |
| Market Sentiment | HODLing, Reduced Selling | Exuberance, Increased Selling |
Monitoring Investor Sentiment Through Search Trends
As the discussion on exchange dynamics revealed the insights they can provide into Bitcoin’s price cycles, it’s now essential to examine another important indicator – investor sentiment reflected through search trends. Google search activity for Bitcoin and other cryptocurrencies can serve as a valuable barometer of public interest and retail investor engagement with the market. Historical data shows that spikes in search volume often coincide with market cycle peaks, while sustained low search interest signals waning excitement and potential for further downside. Monitoring these trends can help anticipate turning points in the crypto market, complementing insights from the Greed Index and other technical indicators to paint a more comprehensive picture of investor sentiment and market cycles.
- Google search activity as a barometer of public interest
- Spikes in search volume coinciding with market cycle peaks
- Sustained low search interest signaling waning excitement
- Monitoring search trends to anticipate turning points in the crypto market
- Complementing the Greed Index and other technical indicators

Correlating Crypto Prices With Macroeconomic Indicators
The correlation between Bitcoin and the S&P 500 has been largely positive in recent years, with the average annual correlation reaching 0.51 in 2024. This relationship can be influenced by macroeconomic events, geopolitical tensions, and regulatory developments, impacting the price action of crypto assets and the overall market cycles. As Bitcoin has gained legitimacy through the successful launch of over 10 Bitcoin Spot ETFs, institutional investors now hold over 1.5% of the supply. Governments are also ramping up cryptocurrency regulation efforts to promote stability and consumer protection. Moving averages, relative strength, and supply and demand dynamics are key technical indicators for traversing these evolving macroeconomic conditions.
Assessing the Impact of Institutional Adoption on Market Cycles
As institutional investors have increasingly embraced cryptocurrencies, their impact on market cycles has become more pronounced. Key ways institutional adoption has reshaped crypto markets include:
- Increased liquidity and reduced price volatility, contributing to more stable market cycles
- Integration of financial products like ETFs and futures attracting traditional investors, enhancing market maturity
- Reduced market dominance of retail investors, leading to less extreme boom-and-bust cycles
- Dampened impact of emotional and speculative trading on overall market dynamics
- Improved market stability due to regulatory clarity and greater institutional involvement, reducing the severity of crypto market cycles
These developments underscore how the growing presence of institutional players is transforming the fundamental nature of cryptocurrency markets.
Frequently Asked Questions
What Are the 4 Cycles of Crypto?
The four key cycles of the crypto market are accumulation, uptrend (bull market), distribution, and downtrend (bear market). The accumulation phase follows market bottoms, marked by stability and low public interest. The uptrend sees rising prices driven by positive news and increasing investor enthusiasm. The distribution phase features price peaks as early investors begin selling, signaling a potential downturn. Finally, the downtrend involves falling prices, often exacerbated by negative news and market pessimism.
What Are the Best Indicators for Crypto Trading?
Crypto traders, the markets can be a roller coaster, but technical indicators are your seatbelt. Consider the RSI to spot overbought/oversold conditions, the MACD for trend shifts, and the Fear & Greed Index to gauge sentiment. Dig deeper with on-chain data like Bitcoin Dormancy Flow and MVRV Z-Score to uncover market cycle trends. Exchange flows also provide valuable insights into investor behavior. These tools can help you navigate the crypto landscape, so buckle up and make informed decisions.
How to Tell if Crypto Is Going Up?
To determine if crypto is going up, look at the exchange balances. If they’re declining, it suggests reduced selling pressure as holders withdraw Bitcoin for long-term storage. Additionally, a low MVRV Z-Score under 3 indicates potential for further price appreciation. However, decreases in the 1+ Year HODL Wave and high Dormancy Flow may signal selling pressure from long-term holders. Monitor these metrics to gauge the crypto market’s directional momentum.
What Are the Bullish Indicators for Crypto?
When considering bullish indicators for crypto, look for declining exchange balances, low Dormancy Flow, MVRV Z-Scores under 3, and rising 1+ Year HODL Waves. These suggest increased investor confidence, long-term holding, and the potential for further price appreciation. Additionally, Terminal Price calculations projecting a peak above $200,000 this cycle signal expectations for continued Bitcoin growth. These technical indicators point to a bullish crypto market.
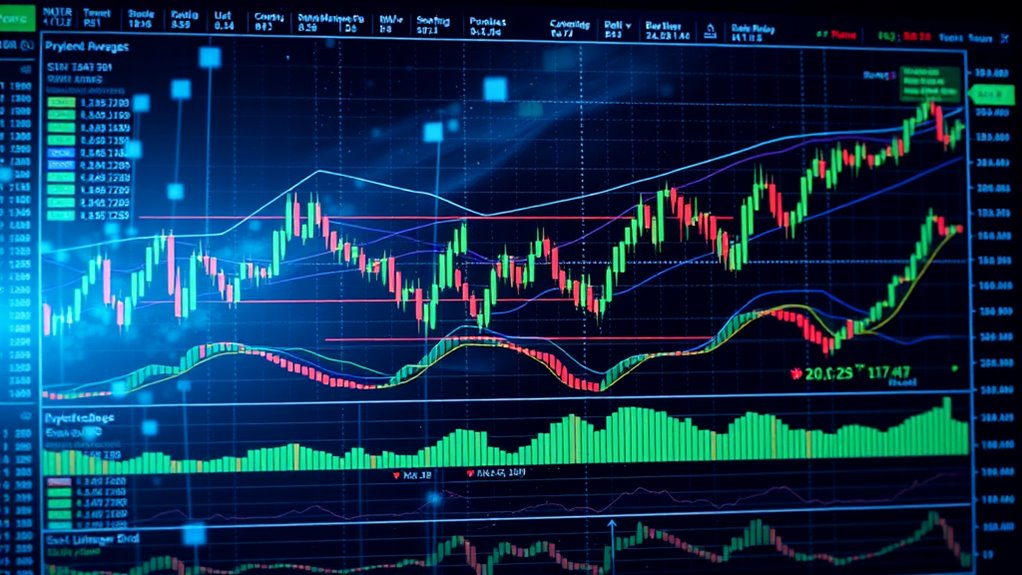
Technical indicators like moving averages and RSI provide valuable insights into the timing and momentum of digital asset cycles.
Technical indicators help traders understand the cyclical patterns that emerge as crypto monetary systems mature and establish predictable market behaviors.
Technical indicators like RSI, MACD, and moving averages help traders identify patterns and predict turning points in digital asset cycles.
Understanding how monetary systems crypto markets operate through cycles helps traders identify optimal entry and exit points using technical analysis.