
Utilizing RSI in Cryptocurrency Technical Analysis
In the tumultuous world of cryptocurrency, the Relative Strength Index (RSI) can be a guiding star, illuminating the ebb and flow of market sentiment. By mastering this technical indicator, you’ll access a deeper understanding of the digital asset landscape, empowering you to navigate the volatile tides with greater confidence. Delve into the intricacies of RSI and discover how it can elevate your cryptocurrency trading strategies, providing a competitive edge in the ever-evolving crypto domain.
Key Takeaways
- Cryptocurrency markets are highly volatile, so traditional RSI thresholds of 30 and 70 may not accurately identify overbought and oversold conditions.
- Monitoring RSI divergences from price can be more effective in cryptocurrency analysis, as they can signal potential trend reversals.
- Combining RSI with other momentum indicators, such as MACD, can provide more reliable signals for entry and exit points in cryptocurrency trading.
- Adjusting the RSI time frame beyond the standard 14 periods may be necessary to account for the increased volatility in cryptocurrency markets.
- Cryptocurrency traders should use RSI as part of a wider technical analysis framework, rather than relying on it as a standalone indicator, to make informed trading decisions.
What Is the Relative Strength Index (RSI)?
The Relative Strength Index (RSI) is a widely used technical analysis momentum oscillator that measures the speed and change of price movements in a cryptocurrency asset. This indicator ranges from 0 to 100 and is used to identify overbought (above 70) and oversold (below 30) market conditions. The standard RSI calculation uses the previous 14 periods to determine the average gains and losses, providing insight into market momentum. Divergences between price action and RSI can signal potential trend reversals or changes in market sentiment. The RSI is a valuable indicator for cryptocurrency trading, helping traders identify entry and exit points for their trades.
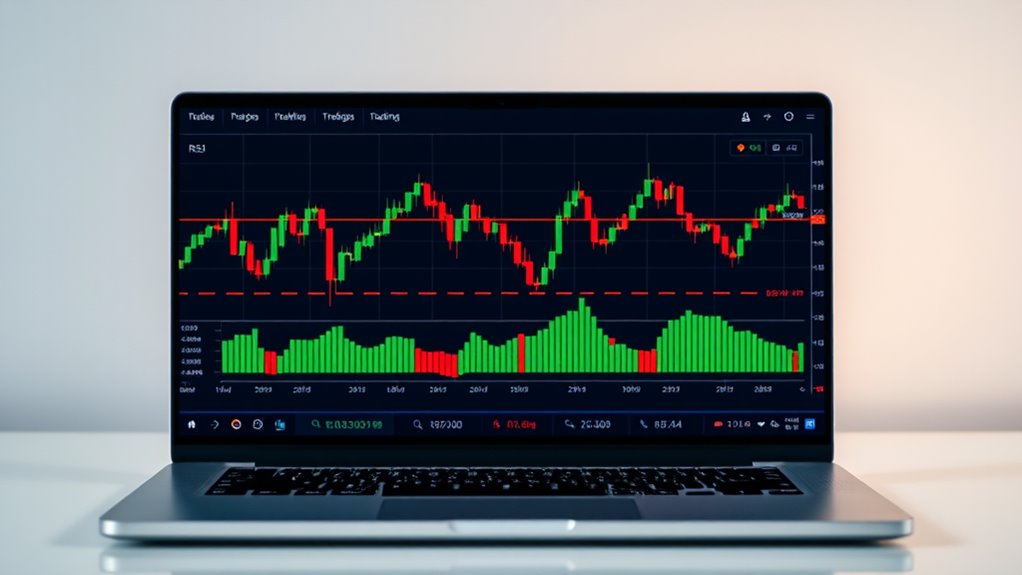
Calculating the RSI
Calculating the Relative Strength Index (RSI) isn’t as complex as it may seem. The formula is straightforward: RSI = 100 – 100 / (1 + RS), where RS is the average of absolute upward price changes divided by the average of absolute downward price changes over the past 14 periods. This RSI calculation can be applied to any market, including cryptocurrencies.
The RSI indicator oscillates between 0 and 100, with values above 70 considered overbought and below 30 oversold. A bullish or bearish divergence between the RSI and the price can signal a trend reversal. The standard 14-period RSI is the recommended setting, but you can experiment with different timeframes to match your trading style and market conditions. By understanding the RSI calculation, you can utilize this powerful technical analysis tool to identify potential buying and selling opportunities in the crypto market.
Interpreting RSI Levels
When interpreting RSI levels, you’ll want to pay close attention to the upper and lower thresholds. An RSI reading above 70 indicates the asset is overbought, while a reading below 30 suggests it’s oversold. The neutral zone, where the market is neither overbought nor oversold, lies between 30-70. Sustained RSI readings outside this range can signal potential price reversals, and sharp divergences between price and RSI can warn of an impending trend change. Keep an eye out for bullish divergences (lower lows in price but higher lows in RSI) and bearish divergences (higher highs in price but lower highs in RSI) – these are important signals to watch for when making trading decisions.
| RSI Reading | Interpretation |
|---|---|
| Above 70 | Overbought |
| 30-70 | Neutral |
| Below 30 | Oversold |
| Sustained Readings Outside 30-70 | Potential Price Reversals |
| Sharp Divergences Between Price and RSI | Impending Trend Change |
Identifying Overbought and Oversold Conditions
Although the relative strength index (RSI) is a widely used technical indicator, properly identifying overbought and oversold conditions requires a nuanced approach. An RSI reading above 70 signals the cryptocurrency is overbought, indicating a potential price correction or downtrend. Conversely, an RSI below 30 signals the cryptocurrency is oversold, suggesting a potential price rally or uptrend. Divergence between RSI and price action can also provide valuable insights. Bearish divergence, where price makes higher highs but RSI makes lower highs, signals a potential downtrend. Bullish divergence, where price makes lower lows but RSI makes higher lows, suggests a potential uptrend. Combining RSI analysis with other technical indicators can help traders identify ideal entry and exit points for their cryptocurrency trades.

Divergence and Convergence in RSI
Identifying bullish divergence, where price makes lower lows but the RSI indicator shows higher lows, can signal an upcoming price increase. Recognizing bearish divergence, where price makes higher highs but the RSI indicator shows lower highs, may suggest an impending price decline. Convergence, when price and RSI move in the same direction, can confirm strengthening momentum and help identify potential trend reversals.
Identifying Bullish Divergence
Bullish divergence on the Relative Strength Index (RSI) is a powerful technical analysis signal that can alert traders to a potential trend reversal. This pattern occurs when an asset’s price makes lower lows, but the RSI indicator makes higher lows, signaling strengthening upward momentum. Identifying bullish divergence on the RSI can provide an early signal to enter a long position before the price reverses upward. Traders should confirm this signal with other technical indicators and analyze the broader market context to increase the reliability of the bullish divergence pattern. This divergence is considered a strong signal of an impending trend change, as it indicates the selling pressure is slowing while upward momentum is building.
Recognizing Bearish Divergence
Just as bullish divergence on the RSI can signal an impending trend reversal, its counterpart – bearish divergence – can warn of a potential market top. Bearish divergence occurs when the RSI makes lower highs while price continues to make higher highs, indicating weakening momentum. This divergence between price and RSI can be a leading indicator of an imminent trend change, providing traders with an opportunity to enter short positions. To confirm bearish divergence signals, traders should also analyze other technical indicators and the broader market context before acting. Recognizing bearish divergence on the RSI can be an effective way to identify potential sell signals and time market tops in the cryptocurrency market.
Convergence Trend Confirmation
While bearish divergence can signal an impending trend reversal, you’ll want to also look for convergence between price and the RSI to confirm the overall market direction. Convergent trend confirmation happens when the RSI indicator, a technical analysis tool and momentum oscillator developed by Welles Wilder, moves in the same direction as the price. This alignment between the RSI and the market’s upward or downward price movements strengthens the existing trend, helping traders make more confident decisions. Monitoring both divergences and convergences in the RSI can provide valuable insights into the cryptocurrency market’s momentum, allowing you to better anticipate future price swings.
Incorporating RSI Into Crypto Trading Strategies
Savvy cryptocurrency traders often incorporate the Relative Strength Index (RSI) into their trading strategies to gain a more thorough understanding of market dynamics. The RSI indicator in crypto can provide valuable insights into overbought and oversold signals, helping traders make informed decisions.
Some key ways to utilize RSI in cryptocurrency trading strategies include:
- Identifying RSI divergence patterns to potentially spot trend reversals.
- Combining RSI levels with other technical indicators, such as moving averages, to improve strategy reliability.
- Setting RSI-based stop-loss orders to automatically close positions and limit losses in volatile markets.
Limitations and Caveats of Using RSI
While the RSI can be a useful indicator, it’s important to understand its limitations. The overbought and oversold thresholds may not always accurately reflect market conditions, as the RSI can remain in overbought or oversold territory for extended periods. Additionally, the RSI is a lagging indicator, meaning it reflects past price action rather than predicting future movements. Keeping these caveats in mind can help you use the RSI more effectively in your crypto trading strategies.

Overbought/Oversold Interpretation
One key limitation of using the Relative Strength Index (RSI) to identify overbought and oversold conditions is that it doesn’t always align with the prevailing trend. In a strong uptrend, for example, the price can remain overbought (RSI above 70) for an extended period. Conversely, in a strong downtrend, the asset can stay oversold (RSI below 30) for quite some time.
To summarize the caveats of using RSI overbought/oversold thresholds:
- Relying solely on these thresholds can lead to whipsaws and premature trades in trending markets.
- RSI is more useful for identifying potential reversals in ranging markets compared to trending markets.
- Divergences between price and RSI can be more reliable indicators of trend changes than overbought/oversold signals.
Lagging Indicator Behavior
The Relative Strength Index (RSI) is a widely used technical indicator, but it’s important to understand its limitations. As a lagging indicator, RSI reflects past price action, which may not accurately predict future price movements. In highly volatile cryptocurrency markets, RSI can generate false signals due to rapid price fluctuations, leading to whipsaws and unprofitable trades. RSI is also less effective in non-trending, range-bound markets, as it may provide conflicting signals when prices consolidate. While RSI can be a useful tool, traders should not rely on it solely and should instead incorporate it with other technical and fundamental analysis to make informed trading decisions.
Combining RSI With Other Technical Indicators
Combining the Relative Strength Index (RSI) with other technical indicators can provide more reliable signals for identifying overbought/oversold conditions and potential trend reversals in the cryptocurrency market. By utilizing indicators like MACD, Stochastic, or Bollinger Bands alongside RSI, traders can gain deeper insights into market momentum and sentiment. Additionally:
- Using RSI divergences with price action and the Accelerator Oscillator can strengthen the precision of entry and exit signals.
- Applying RSI filters to support/resistance levels or trend lines can help validate the strength and validity of those technical patterns.
- Monitoring RSI in conjunction with trading volume can offer insights into the underlying market conviction behind price movements.
Backtesting and optimizing RSI parameters with other indicators is essential for developing a robust and consistently profitable cryptocurrency trading strategy.
Frequently Asked Questions
How to Use RSI Indicator for Crypto Trading?
The RSI (Relative Strength Index) is a valuable technical indicator for crypto trading. It measures the momentum of an asset’s price movement, helping you identify overbought and oversold conditions. To use RSI effectively, look for readings above 70 to signal overbought territory, and below 30 for oversold conditions. This can help you time your buy and sell decisions, aiming to purchase when the asset is oversold and sell when it’s overbought.
What Is the Best RSI Period for Crypto?
The best RSI period for crypto trading depends on your individual trading style and market conditions. As a rule of thumb, a 14-period RSI is a good starting point, as it provides a balanced blend of sensitivity and smoothness. However, a shorter 9-period RSI can be more responsive to volatile crypto markets, while a longer 21-period RSI may be better suited for identifying stronger trends. Ultimately, it’s a matter of trying different settings and back-testing them to find what works best for your strategy.
How to Use RSI Technical Analysis?
Using RSI in technical analysis can be a powerful tool for crypto investors. The best RSI period depends on your trading timeframe, but 14-day RSI is a common choice. To use RSI effectively:
- Identify overbought (above 70) and oversold (below 30) signals to spot potential reversals.
- Look for divergences between price and RSI to detect trend changes.
- Use RSI in conjunction with other indicators for a more extensive analysis.
- Adjust the RSI period based on market volatility and your trading strategy.
Incorporating RSI into your crypto analysis can provide valuable insights to guide your investment decisions.
What Is the 50 50 Strategy for RSI?
The 50-50 RSI strategy is a simple yet effective technique for trading cryptocurrencies in a ranging market. For example, if the RSI crosses above 50, you’d buy, and when it crosses back below 50, you’d sell. This aims to capture the mid-range movement, taking advantage of upward and downward momentum. While it generates more frequent signals than overbought/oversold levels, it should be used with other analysis to confirm trading decisions.
The RSI indicator proves especially valuable when analyzing price movements across various crypto monetary systems due to their inherent volatility patterns.
The RSI indicator has proven particularly valuable when analyzing rsi monetary systems like Bitcoin and Ethereum due to their high volatility patterns.