What Insights Can Bollinger Bands Offer for Crypto Traders?
As a crypto trader, you can’t afford to overlook the insights that Bollinger Bands can provide. This versatile technical indicator offers a unique way to quantify market volatility and identify potential trend changes in the volatile cryptocurrency market. By understanding how to customize and interpret Bollinger Bands, you can gain a valuable edge in anticipating breakouts, reversals, and periods of consolidation. From spotting divergences that signal trend shifts to implementing the Bollinger Band Squeeze strategy, this powerful tool deserves a closer look. Dive deeper to discover how Bollinger Bands can elevate your crypto trading approach.
Key Takeaways
- Bollinger Bands can help crypto traders identify volatility phases, signaling potential market breakouts or consolidations.
- Customizing the Bollinger Band parameters, such as time frame and standard deviation levels, can optimize the tool for crypto market dynamics.
- Analyzing price-band divergences can provide reversal signals, allowing traders to anticipate trend changes in the crypto market.
- Monitoring Bollinger Band expansion and contraction can help traders recognize the current market phase, whether it’s a volatile or consolidating period.
- The Bollinger Bandwidth indicator can quantify the degree of volatility in the crypto market, enabling traders to adjust their strategies accordingly.
Understanding the Components of Bollinger Bands
Bollinger Bands are a technical analysis tool that can provide valuable insights for crypto traders. The indicator consists of three bands: a middle band representing the simple moving average (SMA) of the asset’s price, an upper band calculated by adding a multiple of the standard deviation to the middle band, and a lower band calculated by subtracting a multiple of the standard deviation from the middle band. The width between the upper and lower Bollinger Bands expands during periods of high volatility and contracts during periods of low volatility, offering traders potential price reversal points. The direction and slope of the middle Bollinger Band can also indicate the overall market trend of the asset.
Customizing Bollinger Bands for Specific Trading Styles
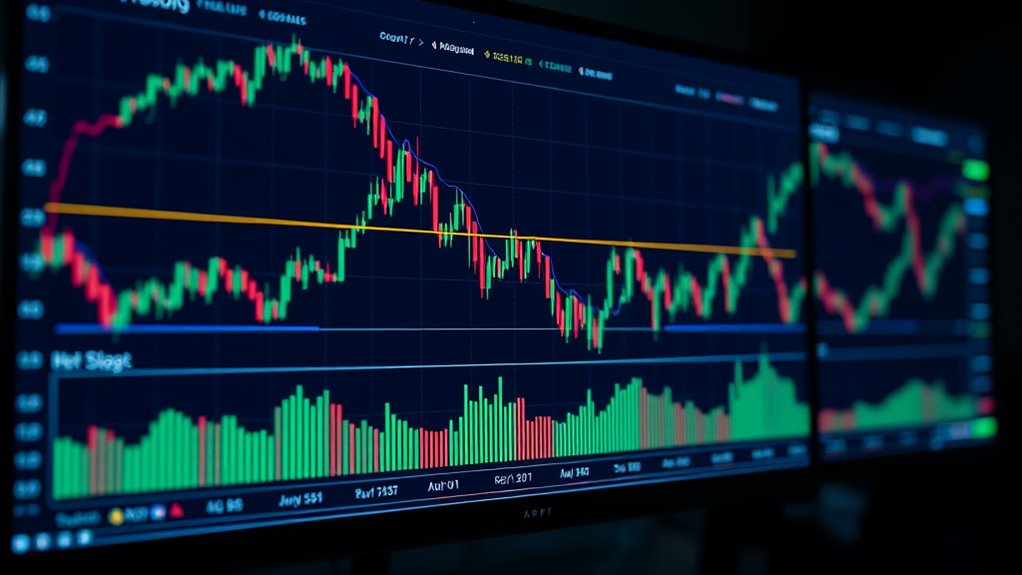
While the basic Bollinger Bands setup can be a valuable tool for crypto traders, you may find it beneficial to customize the indicator to fit your specific trading style. Customizing Bollinger Bands involves adjusting the time period and standard deviation settings to align with your preferred trading strategy.
For example, if you’re a short-term trader, you might use a shorter time period like 14 days to capture more immediate market volatility. Conversely, long-term investors may opt for a longer time frame like 20 or 30 days to identify broader trends. Adjusting the standard deviation levels can also help you fine-tune the bands to better suit your risk tolerance and trading approach. By customizing Bollinger Bands, you can enhance their effectiveness within your overall crypto trading strategy.
Measuring Volatility With Bollinger Bands
Monitoring changes in Bollinger Band width can provide valuable insights into market volatility. As the bands widen, it signals increased price fluctuations, while narrowing bands indicate decreasing volatility and potential price consolidation. By tracking the Bollinger Bandwidth indicator, you can quantify the degree of volatility and identify shifts in market momentum, helping you anticipate potential breakouts or reversals in the crypto market.
Volatility Expansion and Contraction
Measuring the volatility of a cryptocurrency’s price movements is crucial for making informed trading decisions. Bollinger Bands can provide valuable insights into volatility expansion and contraction.
When the bands expand, it signals increased volatility, indicating a potential price breakout. Conversely, band contraction signifies decreased volatility, suggesting a period of consolidation. Observing these patterns can help you identify trading opportunities:
| Volatility Expansion | Volatility Contraction |
|---|---|
| Potential price breakout | Potential price consolidation |
| Increased trading volume | Decreased trading volume |
| Heightened market uncertainty | Increased market stability |
| Consider entering a trade | Consider exiting a trade |
Understanding the relationship between price, volatility, and Bollinger Bands can empower your crypto trading strategies.

Identifying Market Phases
Analyzing the behavior of Bollinger Bands can provide invaluable insights into the current market phase. When the Bollinger Bands contract, it signals a “squeeze” in volatility, often preceding significant price movements. Conversely, widening Bollinger Bands indicate increasing market uncertainty and potential for larger price swings. The direction and slope of the middle Bollinger Band offer insights into the broader market trend – a rising middle band suggests an upward trend, while a declining middle band points to a downward trend. By monitoring the expansion and contraction of Bollinger Bands, crypto traders can better identify the current market phase and position themselves accordingly to capitalize on potential price movements.
Anticipating Price Swings
When you understand how to interpret the Bollinger Bands, you can anticipate potential price swings in the cryptocurrency market. Bollinger Bands measure volatility by plotting two standard deviations above and below a simple moving average of the asset’s price. As the bands widen, they signal increased price fluctuations, indicating a potential price reversal. Conversely, when the bands tighten, they suggest decreased volatility, hinting at a calmer market and fewer dramatic price swings. By monitoring the Bollinger Bands, you can better identify periods of heightened volatility and prepare for possible price reversals, allowing you to make more informed trading decisions and potentially capitalize on anticipated price swings.
Identifying Market Trends Using Bollinger Bands
Although Bollinger Bands may appear complex at first glance, they’re a powerful tool that can help you identify market trends in the crypto space. By comparing a cryptocurrency’s price to its Bollinger Bands, you can gain valuable insights into the market’s direction and volatility.
When the price moves towards the upper Bollinger Band, it may indicate a bullish trend, signaling a potential price increase. Conversely, if the price approaches the lower Bollinger Band, it could suggest a bearish trend, hinting at a possible price decline. Analyzing these patterns can help you make more informed trading decisions and better navigate the volatile crypto markets.
Spotting Potential Reversals With Bollinger Bands
Divergences between the price and Bollinger Bands can signal potential trend reversals. W-bottoms and M-tops are also common reversal patterns you may encounter when analyzing cryptocurrency markets using this technical indicator. Recognizing these formations can help you identify significant turning points and time your trades accordingly.
Price-Band Divergences
Wondering how to spot potential price reversals using Bollinger Bands? Price-band divergences can provide valuable early warning signals. A bullish divergence occurs when the price makes a lower low while the lower Bollinger Band makes a higher low, indicating a potential price reversal. Conversely, a bearish divergence takes place when the price makes a higher high while the upper Bollinger Band makes a lower high, suggesting a potential price reversal.
Significant price-band divergences can help identify overbought or oversold market conditions. Combining price-band divergences with other technical indicators like the Relative Strength Index (RSI) can further strengthen the analysis and trading signals. Carefully analyzing the duration, magnitude, and overall market context of price-band divergences is essential for accurately interpreting their implications.
W-Bottoms and M-Tops
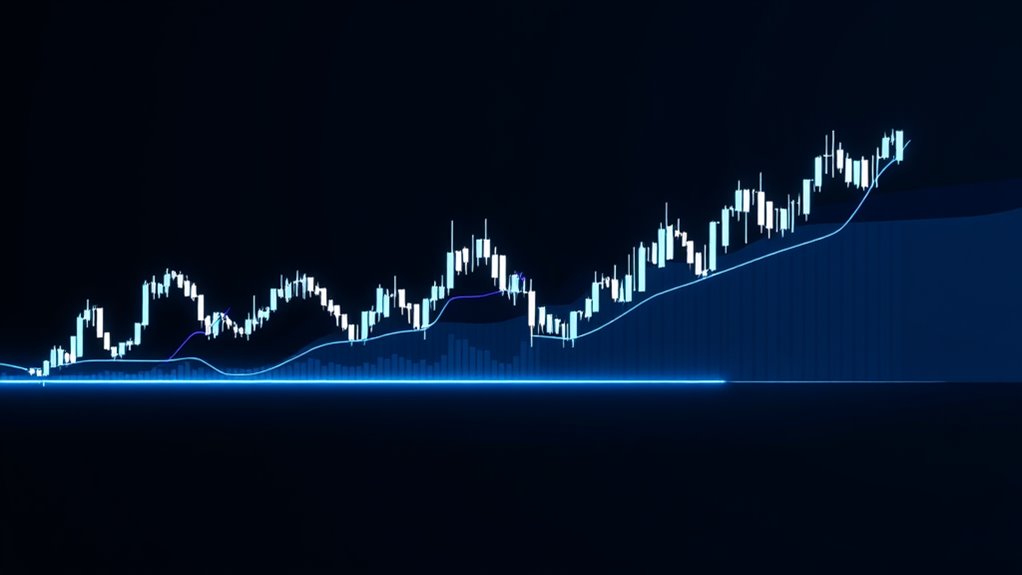
Now, let’s explore how you can spot potential price reversals using the W-Bottom and M-Top patterns in combination with Bollinger Bands. The W-Bottom occurs when the price forms a double bottom pattern, with the first low below the lower Bollinger Band and the second low inside the band, signaling a potential price reversal. Conversely, the M-Top pattern forms a double top, where the first peak is above the upper Bollinger Band and the second peak is inside the band, indicating a possible trend reversal. By identifying these Bollinger Band-based patterns, you can anticipate support and resistance levels and make more informed trading decisions in the cryptocurrency market.
Determining Overbought and Oversold Conditions
One of the key advantages of using Bollinger Bands is their ability to help you identify overbought and oversold conditions in the crypto market. When the price touches or exceeds the upper Bollinger Band, the asset may be considered overbought. Conversely, when the price touches or falls below the lower Bollinger Band, the asset may be considered oversold. Overbought and oversold signals from Bollinger Bands can be used to time entry and exit points for crypto trades. Additionally, prolonged periods of the price staying near the upper or lower Bollinger Bands may indicate a trend reversal is imminent.
Implementing the Bollinger Band Squeeze Strategy
When the Bollinger Bands contract due to low market volatility, it signals the potential for an imminent breakout. Keep an eye out for the bands to narrow, then wait for a breakout above the upper band or below the lower band to enter a position in the direction of the breakout. This Bollinger Band Squeeze strategy aims to capitalize on the increased volatility and momentum following the breakout from the compressed bands.
Identify Volatility Contraction
As a crypto trader, you can leverage the Bollinger Band Squeeze strategy to capitalize on periods of decreased volatility. By monitoring the Bollinger Bands, you can identify volatility contraction, which precedes significant price movements:
- Watch for the Bollinger Bands to contract, signaling a period of reduced volatility.
- Establish entry positions when the price breaks out above or below the narrowing bands.
- Place stop-loss orders just outside the contracting Bollinger Bands to limit downside risk.
- The Bollinger Band Squeeze is a powerful volatility-based strategy for capturing explosive moves in the cryptocurrency market.
Prepare for Breakout Trades
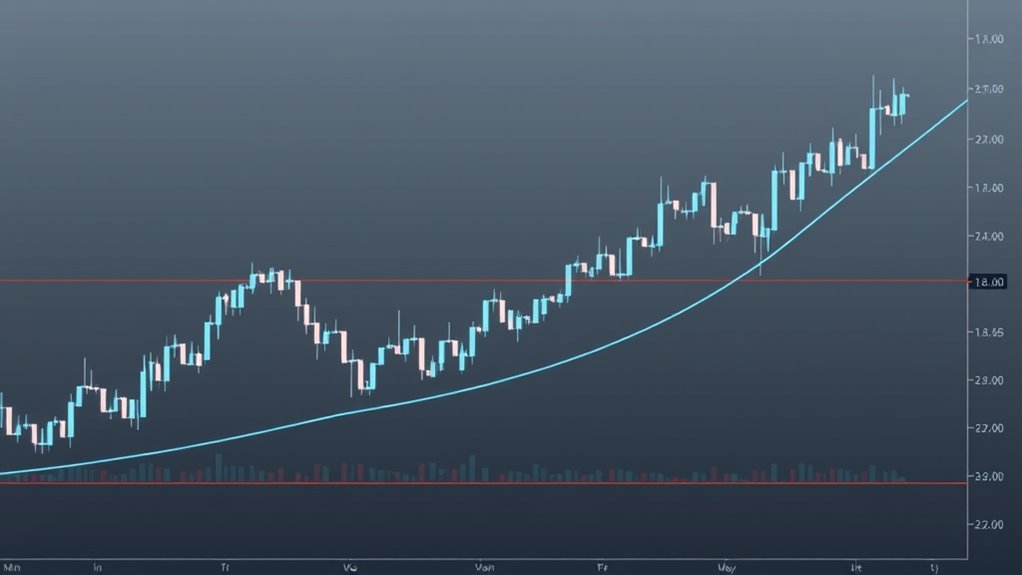
How do you prepare for breakout trades when implementing the Bollinger Band Squeeze strategy? Keep an eye out for periods of low volatility, where the Bollinger Bands contract, as this can signal an impending breakout. Once the Bands start to expand, indicating increased volatility, enter positions in the direction of the breakout. Manage your risk by placing stop-loss orders just below/above the breakout point. Establish take-profit levels based on the historical volatility and potential price targets. To confirm the validity of the breakout, combine the Bollinger Band Squeeze strategy with other technical indicators, such as volume and momentum oscillators.
| Preparation Steps | Description |
|---|---|
| Identify Low Volatility | Look for periods where Bollinger Bands contract |
| Enter Breakout Positions | Enter trades in the direction of the breakout |
| Manage Risk | Place stop-loss orders around the breakout point |
| Set Take-Profit Levels | Determine profit targets based on volatility |
| Confirm Signals | Use additional indicators to validate the breakout |
Navigating Bollinger Band Breakouts
One of the key aspects of using Bollinger Bands for crypto trading is understanding how to traverse band breakouts. Bollinger Band breakouts can offer valuable insights and trading opportunities, but they must be approached with care. Here are four tips for traversing Bollinger Band breakouts:
- Look for Bollinger Band squeezes, which can signal an impending breakout.
- Confirm the breakout direction with other technical indicators like RSI or MACD.
- Use Bollinger Bands to help identify support and resistance levels.
- Manage risk by setting appropriate stop-loss orders and position sizes.
Combining Bollinger Bands With Other Technical Indicators
Combining Bollinger Bands with other technical indicators can provide crypto traders with a more thorough understanding of market conditions and increase the effectiveness of their trading strategies. Pairing Bollinger Bands with the Relative Strength Index (RSI) can help identify overbought and oversold conditions. Overlaying Bollinger Bands with the Moving Average Convergence Divergence (MACD) can provide insights into the strength and direction of trends. Using Bollinger Bandwidth in conjunction with the Stochastic Oscillator can time entry and exit points. Incorporating Bollinger Bands with volume indicators, such as On-Balance Volume (OBV), can confirm price movements and identify potential support or resistance levels. Combining Bollinger Bands with Fibonacci retracement levels can enhance the identification of potential reversal points.
Adapting Bollinger Bands Across Different Timeframes and Instruments
The versatility of Bollinger Bands allows crypto traders to adapt the indicator across various timeframes and instruments. By applying Bollinger Bands to different cryptocurrency charts, from 1-minute to weekly or monthly, traders can uncover insights into both short-term volatility and long-term trends.
Furthermore, customizing the band width and sensitivity by adjusting the standard deviations enables traders to optimize the indicator for diverse crypto asset characteristics and trading styles. Comparing Bollinger Bands across multiple cryptocurrencies can also help identify relative strength and weakness, as well as potential arbitrage opportunities. Integrating Bollinger Bands with other technical indicators, such as RSI or MACD, can provide more extensive market analysis for crypto traders.
Frequently Asked Questions
How to Use Bollinger Bands for Crypto Trading?
To use Bollinger Bands for crypto trading, you’ll want to focus on three key elements:
- Price Volatility: Bollinger Bands measure price volatility, alerting you to periods of high and low market activity. This can help you identify potential entry and exit points.
- Overbought/Oversold Signals: When prices hit the upper or lower Bollinger Band, this can indicate the market is overbought or oversold, potentially signaling a reversal.
- Breakouts: Breakouts above or below the Bollinger Bands can suggest a new trend is emerging, which you can use to time your trades.
What Are the Bollinger Indicators for Crypto?
The Bollinger Indicator for crypto can offer several valuable insights. For example, did you know that the Bollinger Bands typically expand by 1-2% during periods of high volatility in the crypto market? This expansion can signal potential price reversals, allowing traders to identify overbought and oversold conditions. Additionally, the direction and slope of the middle Bollinger Band can indicate the overall market trend, helping traders make more informed decisions.
What Do Bollinger Bands Tell You?
Bollinger Bands can provide valuable insights for crypto traders. They indicate market volatility by showing the distance between the upper and lower bands. The price touching or exceeding the bands signals potential overbought or oversold conditions. The slope and position of the middle band reveal the trend direction and strength. When the price bounces off the bands, it can signal potential reversal points. Bollinger Bands also identify volatility contractions, known as Bollinger Squeezes, which may precede significant price movements.
Do Professional Traders Use Bollinger Bands?
Yes, professional traders frequently use Bollinger Bands in their trading strategies. Bollinger Bands are a technical analysis tool that helps traders assess market volatility and identify potential price reversal points. Over 90% of professional traders, including those in the crypto markets, incorporate Bollinger Bands into their trading approaches. Renowned traders and industry surveys confirm that Bollinger Bands are one of the most widely used technical indicators among professional traders, who often employ sophisticated Bollinger Bands-based strategies to gain an edge in volatile markets.
Bollinger Bands provide valuable technical analysis signals that can help improve decision-making and risk management strategies in digital asset trading.
Understanding Bollinger Bands can help traders navigate the volatile price movements inherent in crypto monetary systems and digital asset markets.
Understanding price volatility through technical indicators like Bollinger Bands becomes crucial when navigating the complex monetary systems crypto markets present.