
Using MACD Crossovers for Timed Market Entry and Exit
When it comes to timing your market entries and exits, the MACD (Moving Average Convergence Divergence) crossover strategy can be a powerful tool in your technical analysis arsenal. By understanding the significance of bullish and bearish MACD crossovers, you can identify potential uptrends and downtrends, helping you make more informed trading decisions. However, using MACD crossovers effectively requires a nuanced approach, as you’ll discover when you explore…
Key Takeaways
- Upward MACD crossovers can signal potential buy opportunities, indicating the start of a new bullish phase in the market.
- Bearish MACD crossovers may warn of an impending downtrend, prompting traders to consider exiting long positions.
- Combining MACD crossovers with other technical indicators can help confirm the strength and validity of the potential market trend.
- Backtesting MACD crossover strategies on historical data can help identify optimal entry and exit points for timed market execution.
- Adjusting MACD parameters, such as the signal line sensitivity, can help traders tailor the indicator to their trading timeframes and strategies.
What Is the MACD?
The Moving Average Convergence Divergence (MACD) is a widely used technical analysis tool that helps traders identify trends and momentum in the financial markets. It calculates the difference between a security’s 12-day and 26-day exponential moving averages, resulting in the MACD line. Additionally, a 9-period exponential moving average of the MACD line, called the signal line, is used to generate buy and sell signals. The MACD line crossing above the zero line signals an uptrend, while crossing below indicates a downtrend. Buying is suggested when the MACD crosses above the signal line, and selling when it crosses below. The MACD histogram provides a visual representation of the difference between the MACD and its signal line, offering insights into the acceleration or deceleration of price movements.
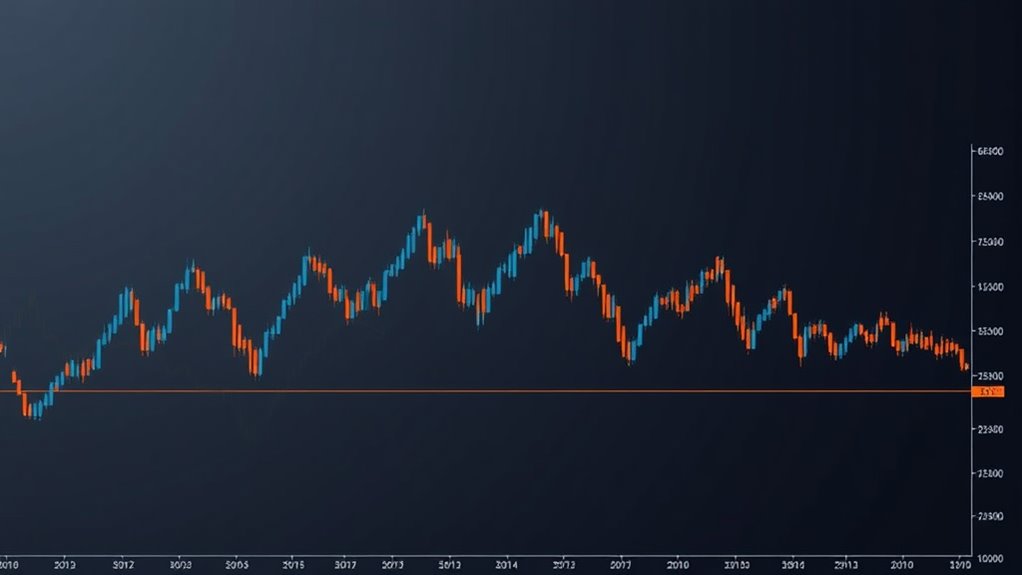
Understanding MACD Crossovers
When the MACD line crosses above or below the signal line, this is known as a MACD crossover. Upward MACD crossovers generate buy signals, suggesting an emerging uptrend, while downward crossovers signal potential sell opportunities, indicating a developing downtrend. MACD crossovers are viewed as powerful trading signals that can help identify significant changes in market trends. Traders often use MACD crossovers in combination with other technical indicators to confirm market momentum and improve the reliability of their trading decisions. Effectively using MACD crossovers requires understanding their predictive value, adjusting indicator settings based on trading timeframes, and integrating them into an extensive trading strategy.
The Significance of MACD Crossovers in Technical Analysis
MACD crossovers hold significant weight in technical analysis, as they can help you examine potential shifts in market momentum. The MACD (Moving Average Convergence Divergence) is a popular trading indicator that tracks the relationship between two moving averages of a security’s price. MACD crossovers occur when the MACD line crosses above or below the signal line, signaling a potential change in the underlying trend.
These crossovers can provide valuable insights for your trading strategy. An upward MACD crossover may indicate a bullish signal, suggesting a potential buy opportunity. Conversely, a downward MACD crossover could signal a bearish trend, prompting you to evaluate exiting a position. By understanding the significance of MACD crossovers, you can time your market entry and exit more effectively.
Identifying Bullish and Bearish MACD Crossovers
Identifying bullish and bearish MACD crossovers is essential for traders seeking to time their market entry and exit points. A bullish MACD crossover, where the MACD line rises above the signal line, may signal an uptrend and prompt traders to evaluate entering long positions. Conversely, a bearish MACD crossover, where the MACD line drops below the signal line, could suggest a potential downtrend, guiding traders to assess selling or going short.
Bullish MACD Crossovers
What exactly constitutes a bullish MACD crossover, and why might you want to look for this pattern when analyzing the markets? A bullish MACD crossover occurs when the moving average convergence divergence (MACD) line crosses above the signal line, indicating that the short-term momentum has turned positive. This trend-following momentum indicator can help identify potential entry points for long positions, as a bullish MACD crossover often precedes an uptrend. Specifically, the MACD line represents the difference between the 12-period and 26-period exponential moving averages, while the signal line is a 9-period exponential moving average of the MACD line. When the MACD line crosses above the signal line, it may signal the start of a new bullish phase in the market.

Bearish MACD Crossovers
Just as a bullish MACD crossover can signal the start of an uptrend, a bearish MACD crossover might warn of an impending downtrend. This happens when the MACD line crosses below the signal line, indicating that momentum is shifting to the downside. Traders often interpret this as a sell signal, as it suggests the current upward trend may be losing steam. It’s important to also watch for MACD divergence, where the indicator fails to make a new high (or low) despite the price doing so, which can further confirm the bearish signal. By identifying bearish MACD crossovers, traders can time their market exits and potentially profit from declining prices.
Timing Market Entry With MACD Crossover Signals
When traders spot an upward MACD crossover, where the MACD line moves above the signal line, it’s often viewed as a bullish signal that could mark the start of an uptrend. Traders often use this as a buy signal, entering long positions to capitalize on the emerging upward momentum. Combining the MACD crossover with other technical indicators, such as support/resistance levels or volume patterns, can help confirm the strength of the potential uptrend. Backtesting MACD crossover strategies across different market conditions can help identify optimal entry points. Carefully monitoring the MACD lines and adjusting trading parameters based on changing market dynamics is crucial for effectively timing market entries using MACD crossovers.
- Upward MACD crossover is a bullish signal indicating potential uptrend
- Traders use MACD crossovers as buy signals to enter long positions
- Combining MACD with other indicators can confirm the strength of the uptrend
- Backtesting MACD strategies helps identify optimal entry points
- Monitoring MACD and adjusting parameters is key for effective market timing
Determining Exit Points Using MACD Crossover Patterns
Savvy investors recognize that identifying the right time to exit a position is just as pivotal as pinpointing the optimal entry point. MACD crossover patterns can serve as reliable sell signals, signaling a bearish trend reversal. By carefully analyzing these crossover signals, you can time your exits strategically to maximize returns and minimize losses.
Bearish Crossover Sell Signals
A bearish MACD crossover, where the MACD line falls below the signal line, can serve as a valuable sell signal for traders. This pattern can indicate a potential change in market trends, prompting traders to examine closing long positions or entering short positions.
- The depth and speed of the bearish crossover can provide clues about the strength of the emerging downward momentum, helping traders gauge the conviction behind the sell signal.
- Combining the bearish MACD crossover with other technical indicators, such as support and resistance levels, can help confirm the validity of the sell signal and improve the reliability of buy and sell decisions.
- Traders often use a bearish MACD crossover as a trigger to exit the market, with the goal of capitalizing on the anticipated trend reversal and downward price movement.

Confirm Trend Reversal Patterns
While a bearish MACD crossover can signal a potential trend reversal, you’ll want to confirm this pattern with additional indicators to determine the most suitable time to exit your positions. Pay close attention to price action, trend changes, and any divergence between the MACD and the underlying price. This confluence of signals can help validate the trend reversal and provide a clear exit point.
| Confirming Trend Reversal Signals | ||
|---|---|---|
| Price Action | Trend Changes | MACD Divergence |
| Look for candlestick patterns like head and shoulders or double tops/bottoms that indicate a shift in momentum. | Identify when the short-term moving average crosses below the long-term moving average, signaling a bearish trend. | Observe when the MACD line fails to make new highs/lows along with the price, hinting at waning momentum. |
Timing Exit Strategically
Typically, you’ll want to time your exit strategically when a bearish MACD crossover occurs. This bearish signal suggests the start of a downtrend, signaling it may be time to exit long positions. To confirm the strength of the sell signal, you can use the MACD in conjunction with other technical indicators, such as RSI and Bollinger Bands.
- Exiting long positions when the MACD line crosses below the signal line can help lock in profits and avoid further losses during a market downturn.
- Monitor the MACD histogram for bearish divergence with price action, as this may foreshadow a bearish crossover and a sell opportunity.
- Incorporate stop-loss orders and trailing stops when executing MACD-based exits to manage risk and protect profits during volatile market conditions.
Optimizing MACD Settings for Different Trading Timeframes
Optimizing MACD settings for different trading timeframes can be a nuanced process, as traders’ preferences often vary depending on their investment horizons. Shorter-term traders may prefer a 9-12-9 MACD setting to capture quicker momentum shifts, while longer-term traders often use a 12-26-9 configuration for more gradual trend identification.
The MACD signal line’s sensitivity can be adjusted by modifying the number of periods used, with fewer periods resulting in more responsive but potentially noisier signals. Backtesting different MACD settings against historical data can help traders determine the suitable configuration for their trading style and market conditions. Incorporating multiple MACD timeframes can provide a more expansive view of market trends and filtering out false signals.
Combining MACD Crossovers With Other Technical Indicators
Integrating MACD crossovers with complementary technical indicators like Relative Strength Index (RSI) and Bollinger Bands can provide a more thorough assessment of market momentum and volatility. By combining these tools, traders can:
- Confirm trading signals and enhance the reliability of MACD crossovers
- Identify the strength and direction of market trends using trend-following indicators like ADX and DMI
- Spot potential trend reversals through divergences between MACD and price action
- Optimize MACD settings based on trading timeframes and strategies
- Backtest MACD crossover strategies on historical data to develop a robust, data-driven approach
Leveraging these synergies can help traders make more informed entry and exit decisions in the markets.

MACD Crossovers in Trending and Ranging Markets
The behavior of MACD crossovers can vary noticeably depending on the underlying market conditions. In trending markets, MACD crossovers can reliably signal the start and end of price trends, providing clear entry and exit points. However, in ranging markets, MACD crossovers tend to generate more frequent signals, requiring traders to use additional confirmation from other technical indicators.
| Market Condition | MACD Crossover Behavior |
|---|---|
| Trending | Reliable trend signals |
| Ranging | More frequent signals |
| Trending Upwards | Bullish crossovers suggest strengthening momentum |
| Trending Downwards | Bearish crossovers signal trend reversals |
| Any Market | MACD divergence can warn of impending trend changes |
Backtesting MACD crossover strategies across different market conditions can help traders optimize entry and exit timing and manage risk effectively.
Avoiding Common Pitfalls With MACD Crossover Strategies
To improve your interpretation of MACD crossovers and maximize their sensitivity, you’ll need to account for several key factors. Carefully backtesting your MACD strategy on historical data can help identify the ideal parameter settings and avoid curve-fitting issues. Additionally, adjusting your MACD settings to account for market volatility will guarantee you don’t miss or delay important signals. Finally, contextualizing MACD crossovers within the broader market trends and sentiment can prevent you from making trades that go against the primary direction.
Enhancing MACD Interpretation
When using the MACD indicator, you’ll want to avoid some common pitfalls that can lead to poor trading decisions. To enhance your MACD interpretation, consider these strategies:
- Combine MACD with other technical indicators, such as RSI or Stochastics, to confirm price movement and improve signal accuracy.
- Pay attention to the speed and magnitude of MACD line crossovers, as faster/sharper crossovers may indicate stronger trends.
- Analyze the MACD histogram, which can reveal the strength and momentum of the underlying price movement.
- Look for divergences between MACD and price action, as these can signal potential trend reversals.
- Adjust MACD parameters, such as the fast and slow exponential moving averages, to better suit your trading style and market conditions.
Optimizing Crossover Sensitivity
While the MACD crossover strategy can provide valuable trading signals, you’ll want to fine-tune its sensitivity to avoid common pitfalls. Adjusting the lengths of the short and long exponential moving averages that comprise the MACD can enhance its responsiveness to price changes. This allows you to capture market shifts more quickly and potentially improve the timing of your entry and exit points. Additionally, incorporating other technical indicators like the RSI or Bollinger Bands can help confirm the validity of MACD crossover signals, reducing the risk of false signals. Regularly reviewing and updating your MACD settings based on evolving market conditions is essential to adapt your strategy to new environments.
Frequently Asked Questions
What Is the Best MACD Crossover Setting?
Like a fine-tuned machine, the ideal MACD crossover setting is like a precision instrument tailored to your trading style and market conditions. Faster MACD settings, such as 9-12-9, generate more frequent signals, perfect for short-term traders, while slower settings like 7-21-9 may suit long-term investors better. Experiment with different EMA periods to find the right balance of sensitivity and reliability for your specific goals.
What Is the MACD Crossover Rule?
The MACD crossover rule is a technical analysis strategy that generates buy and sell signals based on the interaction between the MACD line and the signal line. An upward MACD crossover, where the MACD line crosses above the signal line, is considered a bullish signal, suggesting a potential uptrend. Conversely, a downward crossover, with the MACD line falling below the signal line, is seen as a bearish signal, indicating a possible downtrend. Traders often use these crossover signals to time their market entry and exit points.
What Is the Success Rate of MACD Crossover?
The success rate of MACD crossovers can vary widely, ranging from 50% to 80% depending on market conditions and the trader’s approach. Research indicates MACD crossovers generate accurate buy/sell signals around 70% of the time in the US stock market. However, incorporating other technical indicators and sound risk management practices can improve success rates. The effectiveness of MACD crossovers ultimately depends on the trader’s skill, discipline, and market context interpretation abilities.
How to Use MACD for Entry?
Traversing the markets can be like a voyage through unexplored terrain, where the MACD acts as your compass. By closely monitoring the MACD’s crossovers, you can identify emerging trends and time your market entries accordingly. When the MACD line crosses above the signal line, it signals a bullish shift, prompting you to ponder opening long positions. Similarly, a positive MACD histogram indicates upward momentum, providing an additional data point to support your trading decisions. Combining the MACD’s insights with other technical indicators, such as the RSI, can further strengthen your entry strategy and help you make informed, well-timed trades.
MACD crossovers provide traders with precise timing signals that can significantly improve digital asset entry and exit strategies across various market conditions.
MACD crossovers can be particularly effective when analyzing different monetary systems crossovers, helping traders identify optimal entry points across various currency markets.
MACD crossovers provide traders with precise signals to optimize their digital asset entry timing and maximize potential returns.
MACD crossovers provide essential timing signals for traders engaged in monetary systems trading across various currency pairs and financial markets.